


Most businesses nowadays use data analytics to improve the performance of their products or to study the market. Data analytics is at the heart of the fourth industrial revolution. However, making sure that the graphs and charts made are trustworthy and reliable is not as easy as producing them.
This is where today’s post comes in. I would like to talk to you about auditing data analytics and how it works. First, I’ll tell you about the different pitfalls of skipping over this step in your workflow. Then, I’ll explain the different steps to follow to audit your data analysis. I’ll also be sure to mention the different techniques you should keep in mind for your audit.
Audit Data Analytics: What If We Don’t Do It?
A data analysis that isn’t properly audited will let errors seep through your thinking and model building, and later on, you may find yourself in one of the following situations. Note that the words in bold should give you an idea about what you ought to expect from a good data analysis.
- Allowing assumptions and personal biases to influence the type of graph you choose to make, resulting in an analysis that is not objective.
- Inability to infer causation from correlation because the data analysis is not comprehensive.
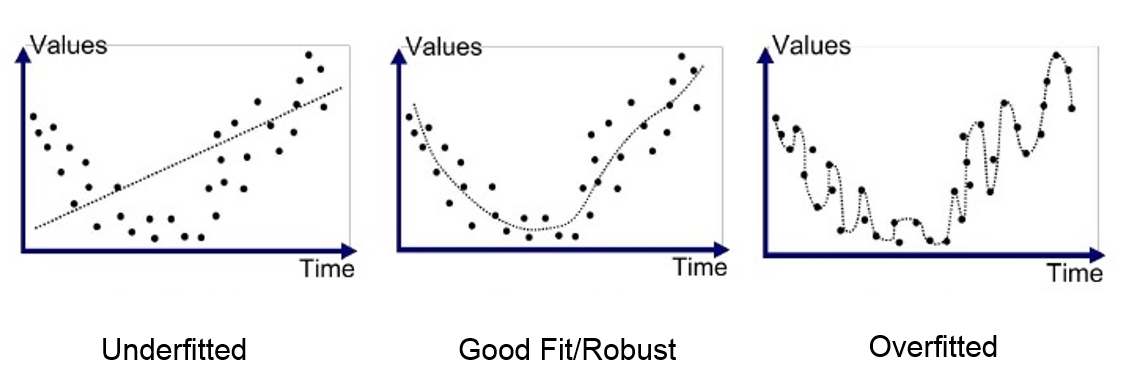
- Overfitting the model later on because of failure to separate noise in the data. This will lead to excellent results on the initial dataset but will exhibit poor results on a new dataset. You can see a chart illustrating this curve fitting here.
- Underfitting your model later on because of failure to explore all the features in the dataset and the relationship they have with each other (correlation, etc.). In this case, we will have poor results across the board on the initial dataset and the new one.
In short, neglecting to audit our data analysis can be very detrimental to our work. Now that we know the risks involved, we can consider how to start our audit.
How to Audit Data Analytics: Where to Start
I think we can all agree that there is a starting point to everything we do. And to start our audit, it is of utmost importance to first ask yourself these questions:
- What’s the purpose of this graph or chart?
- What information can I extract from it?
- Is this information consistent with the company’s data and previously made data analysis? If not, why?
Answering these questions will give us an overview of the usability of the analysis made. Remember that your analysis must have a purpose. We shouldn’t create graphs just for the sake of it. We are looking for information that will bring value to the product or the client or that might reflect a property or an error in the data.

What to Check for During the Audit
During the audit, we must check for several things before moving on to presenting our findings or starting our statistical modeling (applying algorithms to classify our data or predict certain values). It’s not necessary to do these things in order—what I’m providing below is more like a checklist for your data audit.
Check Data Distributions
It’s not enough to use summary metrics (mean, max, etc.). We should aim to create distribution plots like histograms, Quantile-Quantile (Q-Q) plots, and so on. This will allow us to further grasp the important features and detect the outliers.
Keep Track of the Noise
All real-life data contains noise. That’s why it’s crucial to include p-values and estimates of confidence level. Make sure that every number included in your final data analysis is accompanied by the appropriate measure of noise and that your values are up to the standard set by your team.
Check for Consistency Across Multiple Subgroups of the Data
We need to slice the data across the different classes or dimensions and run the same analysis already conducted on the full data to check whether a phenomenon or an observation is true for the different subgroups the data presents. This can provide hints to help uncover any underlying inconsistencies in our final data analysis.
We should beware, however, of The Simpson’s Paradox. Whenever we compare the slices of data, we must make sure that they have the same amount of data to not fall into this type of confusion.
Check for Consistency Over Time
Slicing by units of time is almost always a good idea. Any inconsistencies across the different time instances can reveal either additional information or underlying problems in the data.
Ask Yourself About the Significance of the Plots
Having powerful tools like Matplotlib and ggplot2 that make it easy to create complex graphs can make it tempting to just go berserk and create all types of graphs. Needless to say, this type of approach would just create an endless state of confusion.
A complete data analysis should reflect a coherent thought process. Each graph leads up to the next one. An initial thought process with this mentality can go a long way: “OK, it seems I have some outliers in my data when I visualize my data points. Let me make sure I have a normal distribution by plotting a histogram plot to see if that’s correct.”
When auditing the final data analysis, we should be able to see the story behind the numbers in the graphs. Every graph should provide additional value and be clear and simple to interpret.
Include Used Filters
Keep track of all the different filters and the count of data for each used filter. It will help us later on when making our final presentation to specify details like “this phenomenon only applies to the 6,500 US companies included in the data.” So, during the audit, make sure that all the filters are included.
Mindset During the Audit
It’s important to have an inquisitive and skeptical mindset during the audit. This holds for any process of evaluation during data analysis.
Questions, Not the Data or Available Techniques, Are the Initial Instigators
Data analysis is all about the thought process. We shouldn’t cling to our favorite technique and forget what questions we aim to answer with it. Data should only be there to evolve our questions. An analysis without questions will simply be aimless.

Be Your No. 1 Supporter and No. 1 Skeptic
As we uncover phenomenons during our data analysis, we should get excited. But at the same time, we should keep our heads own. The first questions that should spring to mind are:
- Does this hold for all the data?
- What can invalidate this?
- Where can I find more examples of this occurring?
Being skeptical will help us avoid making incorrect assumptions.
Correlation Does Not Mean Causation
We should always remember this assertion. I have been a victim of that initial excitement you get when you find something in the correlation map, and I have seen others make assumptions as well.
The scientific method should be the basis from which we conclude. And the scientific method specifies that until all tests are run, no similar claims should be made. That’s why clear communications with your audience are necessary. You should inform them what can be proved and what cannot be proved by causality.
Communicate With Your Colleagues
Sometimes, to push yourself you need someone else watching over you. A colleague’s critical eye can’t do you any harm. Make sure to run your analysis by them and listen to their feedback.
Auditing Data Analytics: Not as Easy as It Looks
Data analysis is by no means an easy matter. You have an audience to whom you present your findings and eager consumers that use your products. You will be held accountable and scrutinized during presentations. It’s important to be your first critic. That’s why, to give yourself the best chance, you should take your time during data analysis and the audit to get to the right conclusions. You may have to spend time on tasks that may seem trivial to your audience or to the consumer, such as checking data sources. But remember that making sure that your audience or the consumer appreciates all the steps you take to deliver your analysis is also part of the job.
This post was written by Louay Hazami. Louay is a deep-learning engineer specialized in computer vision and NLP. He’s passionate about AI, and he speaks four languages fluently.